Quantitative Risk Management: The P&L Distribution
Quantitative risk management plays a crucial role in modern finance. It is a subject extensively covered on the web, with numerous excellent articles available. However, many of these articles tend to get caught up in technicalities, when most of us just want to know how it works in a simplified way. In our pursuit of clarity, we have strived to provide simple explanations for these intricate ideas, even going so far as to explain them to ourselves.
It is important to acknowledge that a single perspective, such as the one presented in this article, cannot do justice to the richness and the broadness of the field of quantitative finance. While we won't delve into all the exciting details of financial modeling, our focus will be on presenting a simplified overview. By doing so, we aim to make this intricate topic more accessible to a broader audience.
Risk Management vs Risk Measurement
"It's not the numbers themselves, it's what you do with them that matters."
Before delving into the intricacies of risk management, it is crucial to grasp the fundamental concept of risk itself. What is Risk? Although seemingly straightforward, risk is a multifaceted and elusive notion. To truly comprehend risk, we must take into account two key factors: the uncertainty surrounding future outcomes and the potential benefits or utility derived from those outcomes.
Imagine someone stepping onto a frozen lake. This act involves risk, not solely because the ice may break, but also because the consequences of such an event would be unfavorable. On the other hand, if the frozen lake remains untouched, we would merely discuss the likelihood of the ice breaking. The term "risk" would only come into play if the breaking ice had an impact on someone or something.
Figure 1: Kids Enjoying Winter Fun on a Frozen Lake
Managing risk requires a mindset that acknowledges and embraces uncertainty and randomness. As humans, we tend to prefer certainty in our lives, and thinking about randomness does not come naturally to us. Probability, in particular, can be challenging to grasp intuitively. However, it is crucial not to shy away from this effort. Just as we learn to ride a bike as children, we can also develop the ability to think probabilistically. By doing so, we expand our horizons and become better equipped to navigate the fluid and uncertain nature of our world.
The term "risk" is often linked to negative outcomes or potential losses. However, it is crucial to take into account the entire spectrum of possibilities. This includes evaluating the potential gains, losses, and uncertainties associated with any given investment or financial decision. While in finance, the pursuit of higher profits may be viewed as an upward risk or opportunity, in matters of health, gaining more weight could be considered a downward risk. By acknowledging the full spectrum of risks and opportunities, we gain a comprehensive understanding of the potential outcomes.
Risk Management: In the financial industry probably more than any other, risk management assumes a paramount role. It entails the calculated decision-making process, both tactical and strategic, aimed at effectively controlling downside risks, while simultaneously capitalizing on upside risks, better known as opportunities. Downside risk and upside opportunity are mirror images, and higher risk is compensated by higher expected returns. Successful financial firms are those that effectively manage all risks: controlling the downside and exploiting the upside.
Risk management is as much the art of managing processes and systems as it is the science of measuring and quantifying risk. The ultimate objective of risk management is to leverage the insights gained from risk measurement to effectively navigate future risks.
There is significant value in quantifying concepts and ideas using numbers. Numbers serve as tools that systematize and organize our thoughts, enabling us to better comprehend the world around us. However, it is crucial to grasp the meaning behind these tools and figures. Numbers devoid of understanding are not just useless, but they can also mislead, obscure, or provide a false sense of security.
Risk Measurement: The measurement and language of risk can vary significantly across assets and within a firm. Traders use terms like DV01, adjusted duration, beta, notional amount, and delta, gamma, theta, and vega to assess risk for different types of investments. On the other hand, risk managers may discuss VaR, expected shortfall, or lower semivariance to evaluate the overall risk of a firm. While this plethora of terms can be confusing, they all aim to answer the same fundamental question: What is the variability of profits and losses (P&L)? By viewing risk through the lens of P&L variability, we can establish a unified framework that applies to all asset classes and levels within a firm, from individual traders to the board.
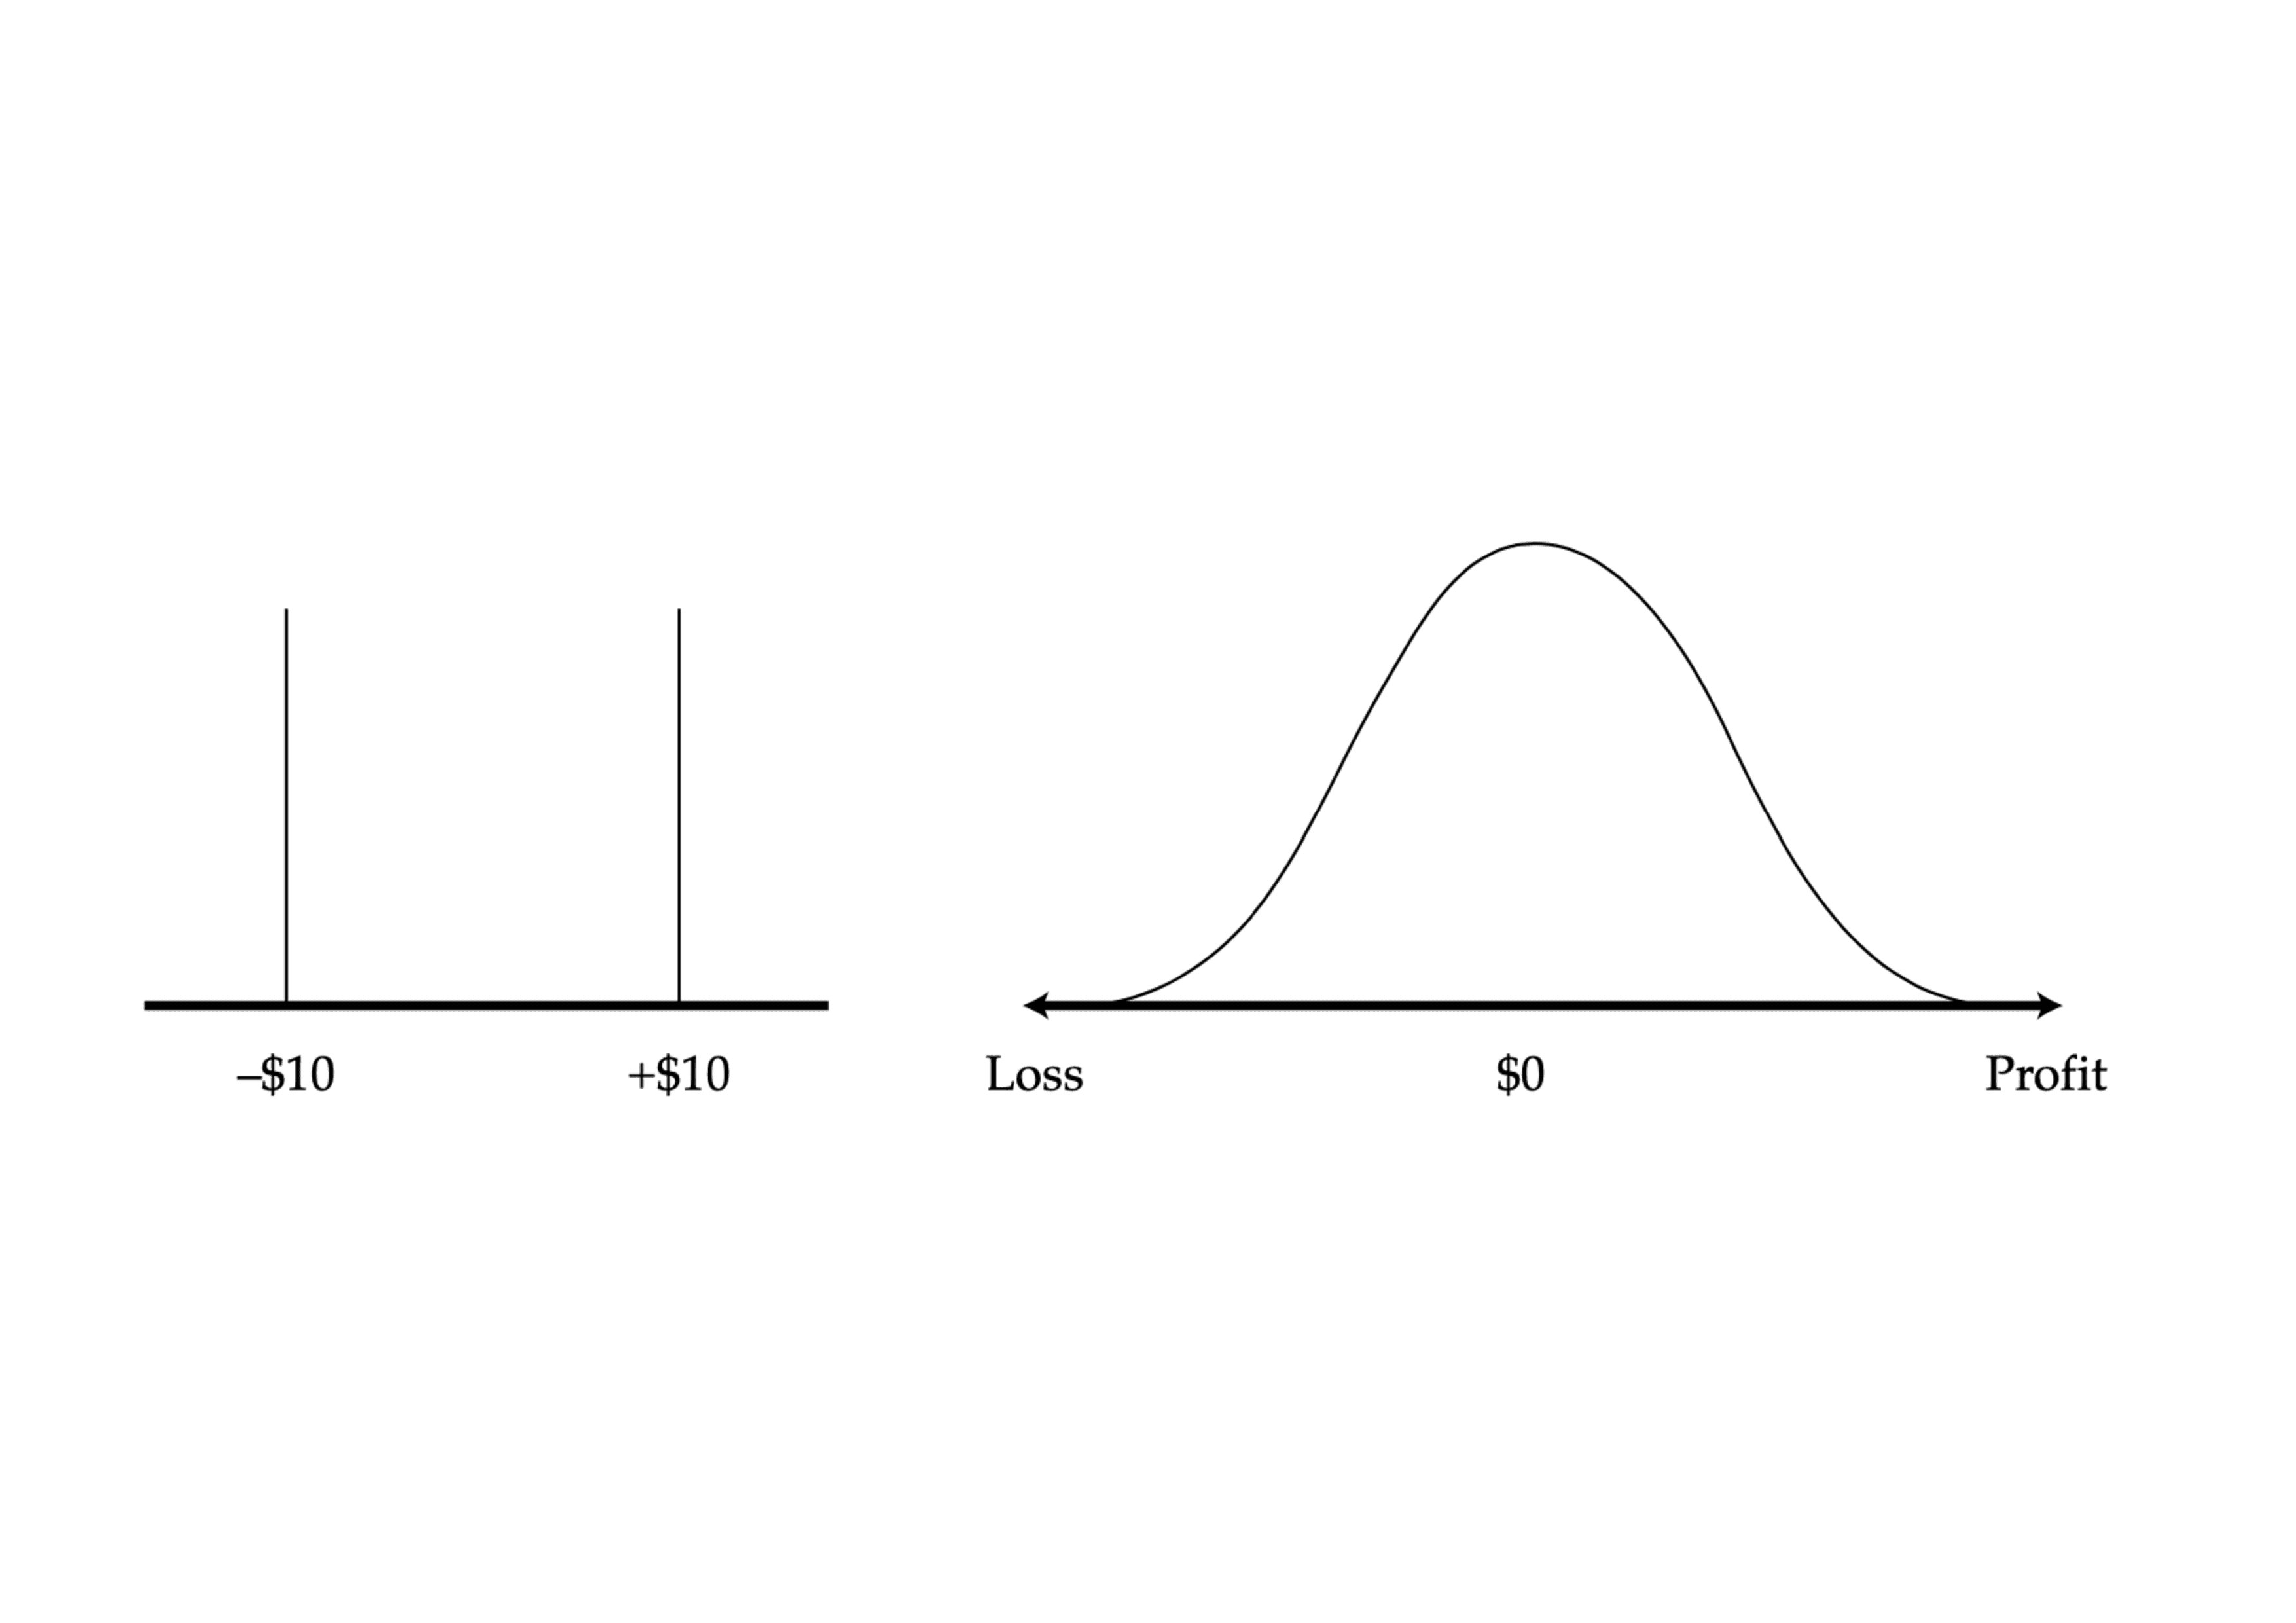
Figure 2: P&L from Coin Toss Bet and Hypothetical Yield Curve Strategy
In Figure 2 above, we can observe the potential profit and loss (P&L) from a $10 coin toss bet and a hypothetical yield curve strategy. The coin toss bet has only two possible outcomes - head or tail, making it a straightforward scenario. On the other hand, the yield curve strategy presents numerous potential outcomes, each with its own probability.
"Risk management is the art of using lessons from the past to mitigate misfortune and exploit future opportunities, the art of avoiding the stupid mistakes of yesterday while recognizing that nature can always create new ways for things to go wrong" Thomas S.
To provide you with a clear mental image, let's consider where the vertical axis represents the probability of a specific outcome, while the horizontal axis measures the level of profit or loss. In the case of the coin toss, each outcome has an equal probability of one-half. However, with the yield curve strategy, there exists a range of potential outcomes, each with its own probability. Ultimately, what matters is the distribution of P&L. This distribution showcases the potential gains or losses one can experience.
To help you visualize the concept, let's consider the market risk associated with a straightforward portfolio.
$ 20 million nominal of a 10-year U.S. Treasury (UST) bond
£7 million nominal of FTSE 100 Index futures, which represents the UK equity index.
To simplify, let's consider a trading firm. The U.S. Treasury bond represents the position held by a fixed-income trading desk or investment portfolio, while the FTSE 100 Index futures represent the positions held by an equity trading desk or investment portfolio.
In order to make well-informed decisions, desk-level traders require a highly detailed perspective on their risk. They need up-to-the-minute information on the exposure or sensitivity of their portfolio to market risk factors. Fixed-income traders may utilize various methods, such as duration, DV01 (also known as basis point value or dollar duration), and 5- or 10-year bond equivalents, to assess their exposure. On the other hand, equity traders might measure the beta-equivalent notional of their positions.
In all cases, traders are measuring the exposure or sensitivity, which refers to how much the position gains or loses when the market moves a specified amount. The DV01 of the 10-year (UST) bond is roughly $850 per bp for each $1 million notional — the bond value will increase by roughly $850 when yields go down by one basis point. For $20 million notional, the decrease in yield would result in a profit of $17,000 i.e ($850*20), and so the volatility of prices is approximately the DV01 times the volatility of yields. The volatility of yield changes is roughly, say 7.15 bp per day. Using the 7.15 bp per day, the volatility of the bond is roughly: $17,000 * 7.15 = $ 127,500.
With this information, we can conclude that such a position would likely result in gains or losses exceeding $127,500 every third day. In other words, there is a 31.8% chance that the bond value will deviate more than one standard deviation from the mean. Is this amount lot? It depends. Depends on what? The size of your wealth. For an investor with total wealth of $500,000, this amount would represent 25.5% of their wealth, which could be considered substantial. However, for a portfolio with $500 million of assets under management, $127,500 would be relatively small, representing only 0.025% of the portfolio.
It is essential to recognize that we are in control of the numbers, not the other way around. Numbers should be employed as our servants. We must not become enslaved by them. Instead, they should assist us in being honest with ourselves and effectively communicating with others.
We have successfully calculated a rough estimate of bond volatility, and we can easily apply the same approach to estimate the volatility of the FTSE 100 Index futures. In fact, estimating the volatility of the FTSE 100 Index futures is even simpler than for bonds. We can effortlessly analyze the volatility of the FTSE 100 Index futures by referring to historical data on platforms such as Bloomberg or Yahoo Finance. Let's assume that the daily volatility is approximately 2.5%. If we hold £7 million or $8.9 million in the FTSE 100 Index, the volatility would be around 2.5%, equivalent to approximately $222,500. Both of these trades share a fundamental similarity: the P&L Distribution. Money is money, and the concept of profits and losses is directly comparable between the two trades.
Financial risk modelling, when encountered for the very first time, the concept may cause mixed feelings, sound intimidating and exotic, but in reality, the devil is never as bad as they paint it. The process is straightforward - generating the profit and loss (P&L) distribution. If we are willing to assume that the P&L distribution follows a normal distribution, and such an assumption is not perfect but for a rough comparison of standard trading conditions, this assumption is perfectly good — it gets us most of the way to the truth.
While risk specialists may delve into concepts like volatility or Value at Risk (VaR) (more on these later), these metrics are merely reflections of the underlying P&L distribution. For desk-traders, the pressing inquiry is centered around predicting the P&L distribution of their positions in the next minute, hour, or day. By understanding the potential range of profits and losses, they can assess the risk-reward tradeoff and adjust their strategies accordingly.
Quantitative risk management heavily relies on the Profit and Loss (P&L) distribution as a fundamental tool. This vital entity empowers traders to navigate the complex world of financial markets with confidence and precision.